Environment
Until recently, for each launch and in addition to the satellite or satellites, a variety of objects has been injected into orbit: launcher upper stages, booster engines, multiple launch adapters, straps, fragments of pyrotechnic devices, pins, optical system covers, etc.
Once they reach the end of their operational life or a failure has caused their premature deactivation, most satellites remain in orbit. The ageing of coatings and equipment, such as solar generators, can lead to partial fragmentation, unless remaining propellant in a tank or a battery overcharge leads to an explosion and the dispersal of hundreds of pieces of debris.
Finally, despite the vast expanse of orbital space, this wreckage, waste and debris sometimes collide, generating yet more fragments.
In order to improve the degree of protection against this environmental risks, the regions in which the space debris evolve as well as how they will evolve on the long term, must be known.
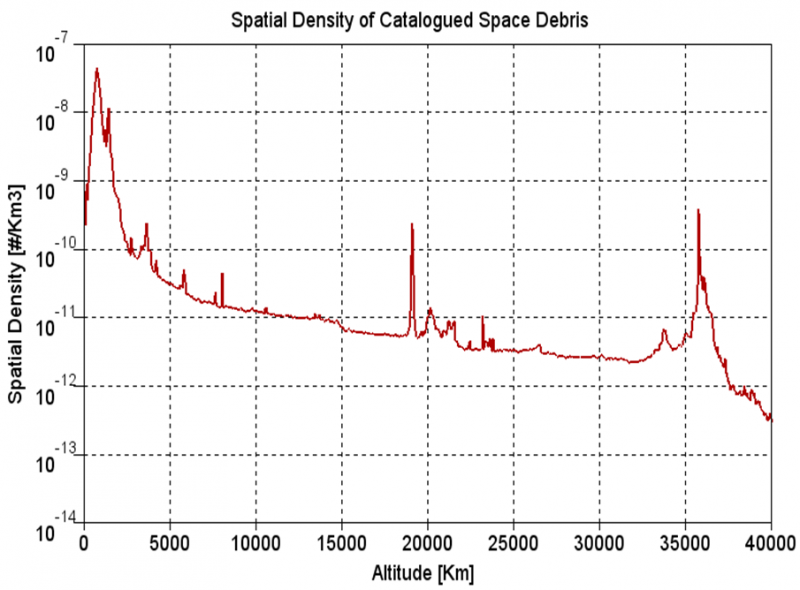
For example, the density of space objects according to the altitude must be identified. This is represented by the number of space debris per unit of volume [1/km3] for a given altitude domain.

Figure 1 presents the areas of interest for space applications or missions.
- Low Earth Orbits (LEO) with altitudes below 2,000 km, comprising most Earth observation satellites and scientific missions.
- Medium Earth Orbits (MEO), with altitudes of around 20,000 km, in particular comprising GPS and Galileo satellites
- Geosynchronous Orbits (GEO), with an altitude of 36,000 km and an inclination close to zero, comprising most telecommunications satellites.

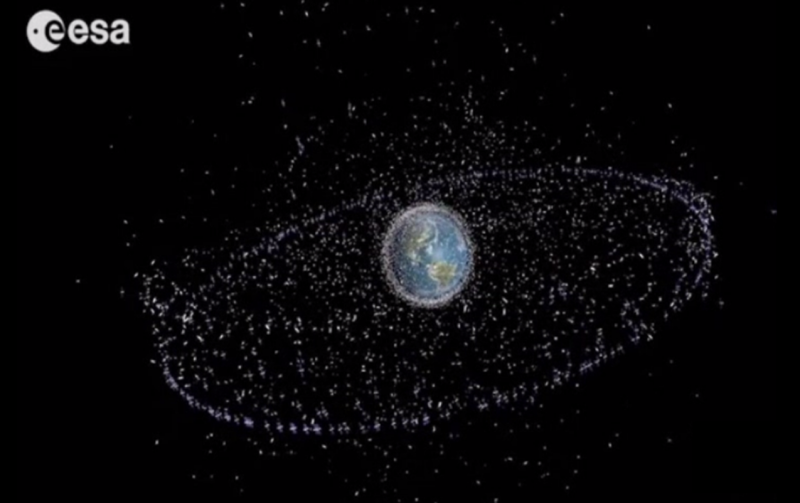
Figure 2 gives a tri-dimensional representation of the distribution of catalogued space debris around the Earth. The geostationary ring is clearly visible, as are Low Earth Orbits, with a far greater spatial density than the rest of the orbits.